
ILLUMINATION OPTICS


© Muschaweck / Rehn 2022
Tools
Beam definitions
For beams in the angular range (such as for spot lights), we suggest to use aI(q) ~ cos
n
q
beam definition because it can be easily integrated over q to calculate FWHM, for example. See our Designing Illumination Optics book for details. Download Julius‘ cos n calculator from Git ! In contrast, if you are dealing with illuminance distributions on a screen (such as for surgical lights) it may be adequate to use a Gaussian beam insteadE(r) ~ exp(-r
2
/2s
2
)
because it can be easily integrated over a circular area.
Rayfile Stuff
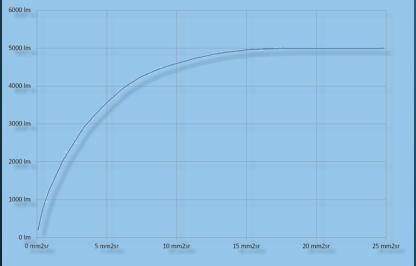
It is helpful to extract some key features from a rayfile such as peak luminance and the flux-over-etendue curve (figure on the left). This curve provides an upper limit on how any flux you can get into a certain etendue (for a discussion see here). The Rayfile Analyzer is an Excel file that reads an ASCII rayfile and presents various analyses.
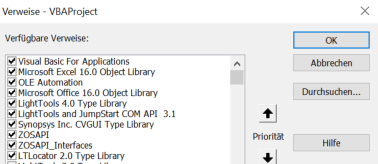
Access and Command
your optics software from Excel
(Henning) OK, I agree that VBA not real coding from a professional point of view. But it is easy, ubiqiutous, and can do a lot for you. It‘s simply practical and useful to calculate sensitivity curves in Excel using optical calculations. Download an Excel VBA demo with matching CodeV, LightTools, and Zemax files.
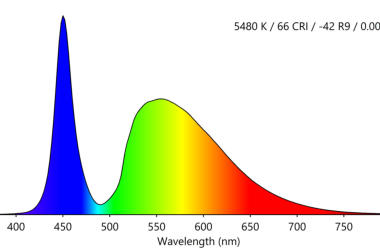
Color
The Sylvania Color Calculator - a magnificient freeware for all your spectral calculations. Thanks John !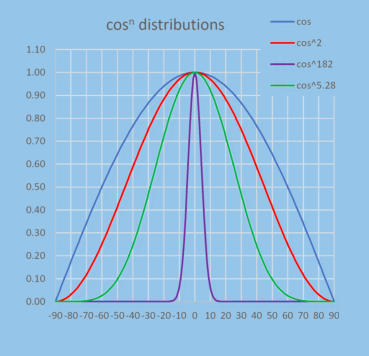


ILLUMINATION OPTICS
© Muschaweck / Rehn 2022
Tools
Beam definitions
For beams in the angular range (such as for spot lights), we suggest to use aI(q) ~ cos
n
q
beam definition because it can be easily integrated over q to calculate FWHM, for example. See our Designing Illumination Optics book for details. Download Julius‘ cos n calculator from Git ! In contrast, if you are dealing with illuminance distributions on a screen (such as for surgical lights) it may be adequate to use a Gaussian beam insteadE(r) ~ exp(-r
2
/2s
2
)
because it can be easily integrated over a circular area.
Rayfile Stuff
It is helpful to extract some key features from a rayfile such as peak luminance and the flux-over-etendue curve (figure on the left). This curve provides an upper limit on how any flux you can get into a certain etendue (for a discussion see here). The Rayfile Analyzer is an Excel file that reads an ASCII rayfile and presents various analyses.
Access and Command
your optics software from Excel
(Henning) OK, I agree that VBA not real coding from a professional point of view. But it is easy, ubiqiutous, and can do a lot for you. It‘s simply practical and useful to calculate sensitivity curves in Excel using optical calculations. Download an Excel VBA demo with matching CodeV, LightTools, and Zemax files.
Color
The Sylvania Color Calculator - a magnificient freeware for all your spectral calculations. Thanks John !